
New technology, new money, new newsrooms, old questions: The State of the News Media in 2014

New technology, new money, new newsrooms, old questions: The State of the News Media in 2014
Pew’s annual omnibus report finds that the transition to digital, and the influx of new money and new ideas, only represents a sliver of activity in the broader media.
Inside the media universe, 2013 seemed to be a year of momentum. New money was being injected into the news business from all sides, from dot-com billionaires to baseball owners to venture capitalists making bets at the intersection of technology and content. At the same time, users were finding news and video through new platforms, whether through an explosion in social media or via the personal window of mobile.
In Pew Research Center’s latest State of the News Media report, just out, you get a glimpse of how the worlds of journalism and technology are continuing to merge and the impact that convergence has on the business and editorial prospects of media companies.
A majority of Americans now say they get news through a digital platform: 82 percent reported using a desktop or laptop, while 54 percent got news through mobile devices, according to Pew. Half of social media users share or repost news stories, while 46 percent discuss news on those sites. Audiences are also spending more time watching their screens: 63 percent of U.S. adults now watch online video, and of that, 36 percent watch news video.
At the same time, the companies that are helping to redefine digital news are expanding aggressively: Pew estimates that digital news operations, from the small hyperlocal shops up to the likes of ProPublica, The Huffington Post, and Vice have produced almost 5,000 full-time editorial jobs. Not enough to make up for a decade of losses in newspapers, but significant.
Traffic-wise, those companies are also challenging legacy media operations for audience. In April, May, and June of 2013, The Huffington Post averaged 45 million unique monthly visitors, which put it behind only Yahoo News as the top news site. BuzzFeed averaged 17 million monthly unique visitors, almost on par with The Washington Post’s 19 million monthly unique visitors.
“This year, what we saw was individuals tied to technology with a deep understanding of technology and digital content begin to tackle news reporting in a way we haven’t seen before,” said Amy Mitchell, director of journalism research for Pew.
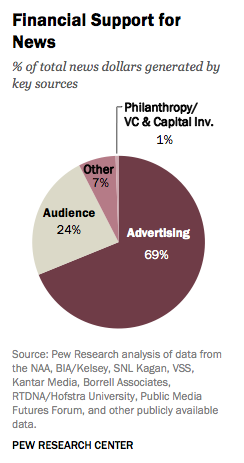 But the State of the News Media report also offers a dose of cold water to the digital media excitement: That new cash flowing in — whether through VCs, philanthropy, or personal investment — represents only 1 percent of the overall funding for journalism. Pew estimates that for-profit digital native news outlets pull in between $500–$700 million in advertising annually, which is just around 1 percent of all news-related advertising across sectors.
While the consumption of news on new platforms is rising, it still occupies a small space in the overall news industry, said Mitchell. “It’s all here, and real,” Mitchell said of the digital newcomers, “but also step back and look at the whole picture of news that consumers are receiving, and where does this fit in that? And it’s a small piece, at this point.”
On the business side, Pew found that audience-derived revenue — through paywalls, cable subscriber fees, and other sources — was growing both as a dollar figure and as a share of overall revenues. But it’s uncertain whether that increase is driven by a more paying readers or if news companies are just squeezing more money out of existing customers.
Mitchell said there’s still plenty of uncertainty in the business models for news. Nonprofit news outlets need to find sources outside of foundation funding; most news companies are still heavily dependent on advertising; and digital news sites are still developing new sources of revenue. “There is that big question mark next to the dollar sign that lets people think about what the future of sustainability is,” Mitchell said.
Circulation revenue at daily newspapers was up 5 percent for the year, driven largely by new paywall plans. But newsstand sales of magazines fell by 2 percent. While cable news audiences declined, local TV news saw modest increases in viewership, and evening network newscasts were up.
That’s all just the tip of the iceberg: As always, this is a huge report, with a wealth of information for media nerds. Pour a nice cup of tea, find a comfy chair, and set aside some time for reading. Here, in no particular order, are some of the more interesting takeouts from this year’s State of The Media report:
How news makes money in 2013
Pew estimates the U.S. news industry generates around $63–65 billion a year. But advertising remains the backbone of the business, making up two-thirds of revenue for news organizations. The area seeing the most growth is audience revenue, which includes subscriptions (digital or print), premium services (like Politico Pro), TV bills (cable and satellite), and the types of voluntary contributions that go to nonprofit news.
Daily newspaper subscriptions make up almost 70 percent of audience revenue, totaling $10.4 billion in 2013. But Pew’s research suggests that media companies aren’t pulling in new paying customers, but rather extracting more money from a shrinking pool. Giving to public radio stations was down by 3 percent in 2012, but the $400 million raised was still the second-highest dollar amount in 16 years. Similarly, Pew points out that newspaper and magazine circulation numbers are flat overall as subscription revenues are up.
According to data from eMarketer, digital advertising on the desktop web generates more than 3× the money of mobile. In 2013, desktop advertising brought in $33 billion, up a smidge from the previous year. Mobile jumped to $9.6 billion in 2013 from $4.4 million the previous year.
The report also included a good comparison graphic of revenues from digital-only outlets:


0 comments:
Post a Comment